Building the grading system that tracks mastery, not marks with AI saving teachers hours of setup
Standards based grading is how schools track whether students have actually mastered what they're learning, not just what they scored on a test. It's one of the most requested capabilities in US public schools and the Australian curriculum system, and Toddle didn't have it.
As the designer and product lead for this initiative, I was responsible for understanding how standards based grading works across different school systems, mapping the full lifecycle across admins, teachers, and students, building the roadmap, and designing the system from the ground up. We also used AI to reduce the two hardest parts of the setup process, generating rubric descriptors and uploading standards, turning what used to take hours into minutes
What did we achieve?
We onboarded 20+ schools in 4 weeks, broke into US public and Australian curriculum markets, and helped teachers save 35–50% of their time by consolidating workflows into one platform.
20+ schools onboarded in the first 4 weeks of demoing
Helped break into new markets, including US public schools and Australian curriculum schools
100% of schools who saw the demo expressed strong interest in adopting the standards-based workflow
Enabled smoother adoption by unifying multiple grading and assessment tools into one platform
35–50% potential time savings identified for teachers
Received enthusiastic feedback from school decision-makers and curriculum heads
Savings driven by consolidating workflows and reducing dependency on multiple tools
Users appreciated the clarity in performance tracking, especially in rubric-driven mastery grading
AI-powered rubric and standards creation, saving teachers 10+ hours a week
Automated rubric and descriptor generation using AI, reducing creation time by 70%
AI-assisted standards creation process, reducing manual effort in building curriculum-aligned content
92% of schools we piloted the demo with switched to Toddle from competitors
Gradual rollout started with 5 pilot schools for phased feedback collection
Actively iterating based on real classroom usage — cadence of biweekly updates and fixes
Planning for full-scale release targeting 100% of schools using our assessment tools
We heard schools describe grades in a completely different language
During conversations with schools, and through requirements surfaced by the sales team, we kept hearing feedback like: "You're developing in reading and proficient in writing" rather than "you got 78 out of 100." Schools weren't thinking in scores. They were thinking in skills, standards, and mastery levels.
Our grading system was built around scores, not standards
Toddle had skills — teachers could rate students on ATLs and similar dimensions — but it wasn't a grading method. It was a layer on top of a score-based system. For a large number of schools, standards-based grading wasn't a nice-to-have. It was how they operated day to day.
So we built a new grading system from the ground up, covering standards, gradebook, rubrics, and reporting
Rather than retrofitting scores, we made a deliberate choice to build standards-based grading as a first-class grading method. Schools could now define standards, map them to assignments, and report on mastery — the way they actually think about student progress.
Standards measure mastery. Scores just measure performance.

RESEARCH
We interviewed pilot schools to understand their specific needs and identify exactly what needed to be built
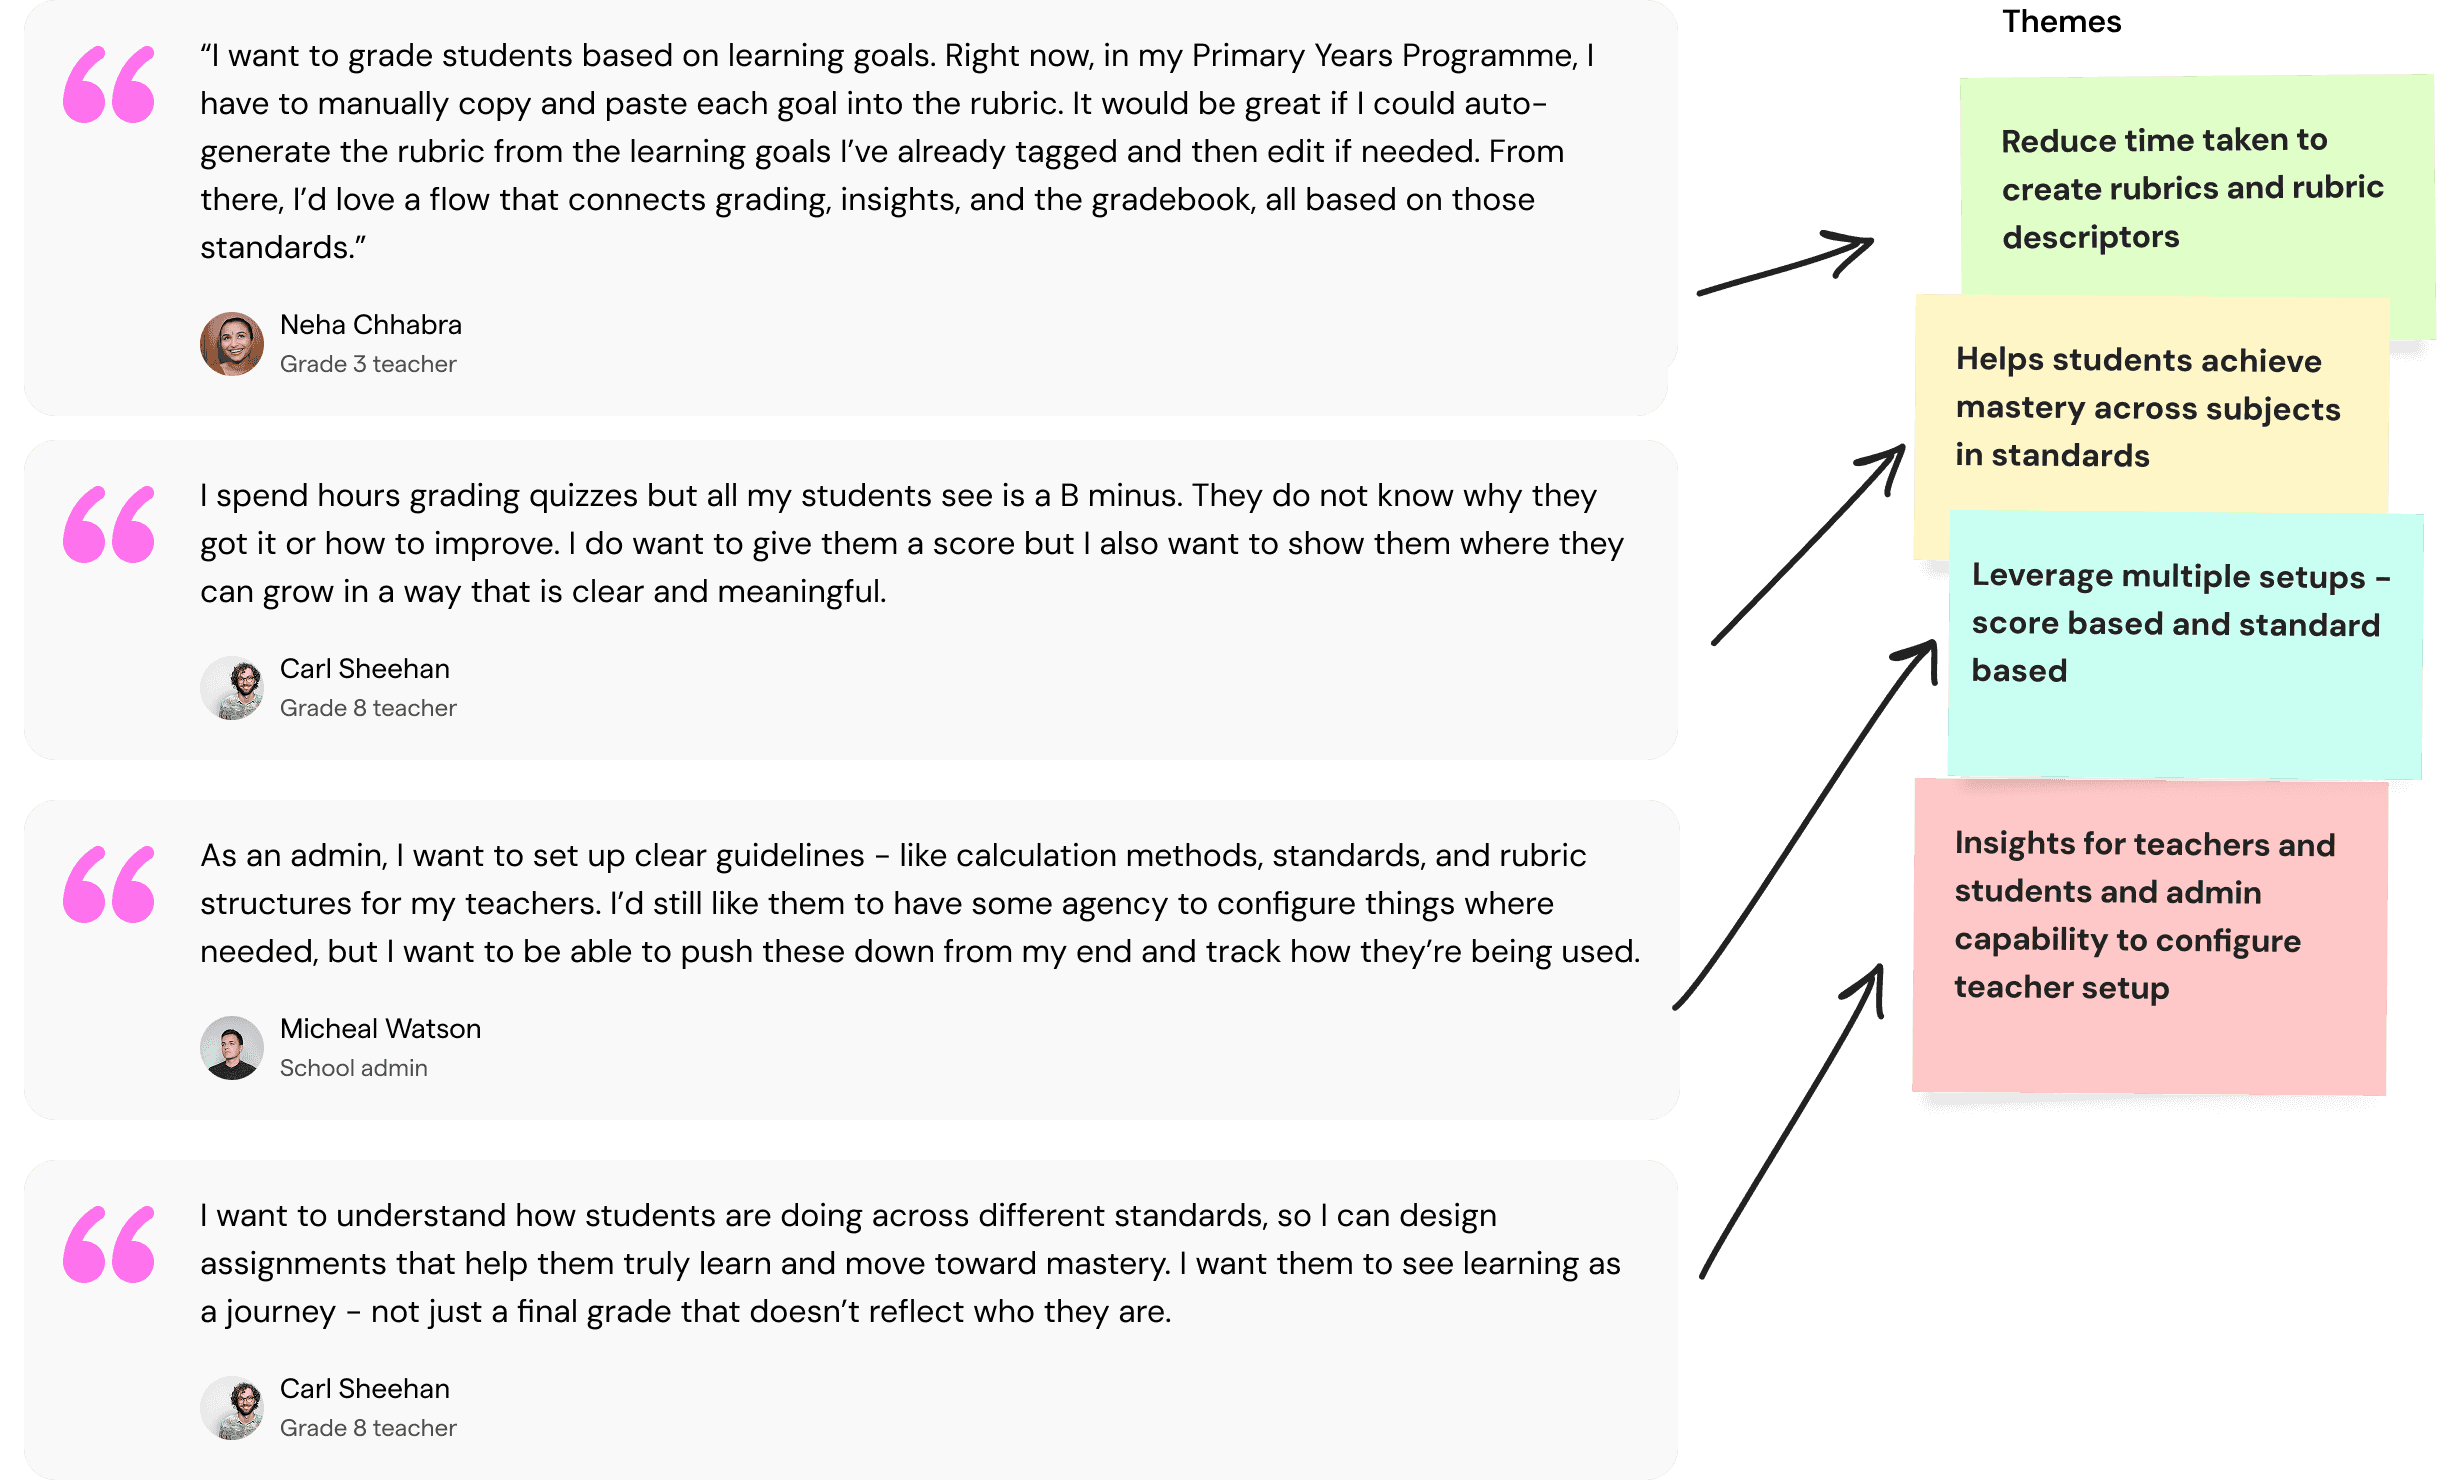
We used interview insights to map the full standards-based grading flow, then validated each step against competitor products
We built every step of the standards journey into Toddle, so teachers could set what students need to learn, tie it to their materials and assessments, and see exactly where each student stands.

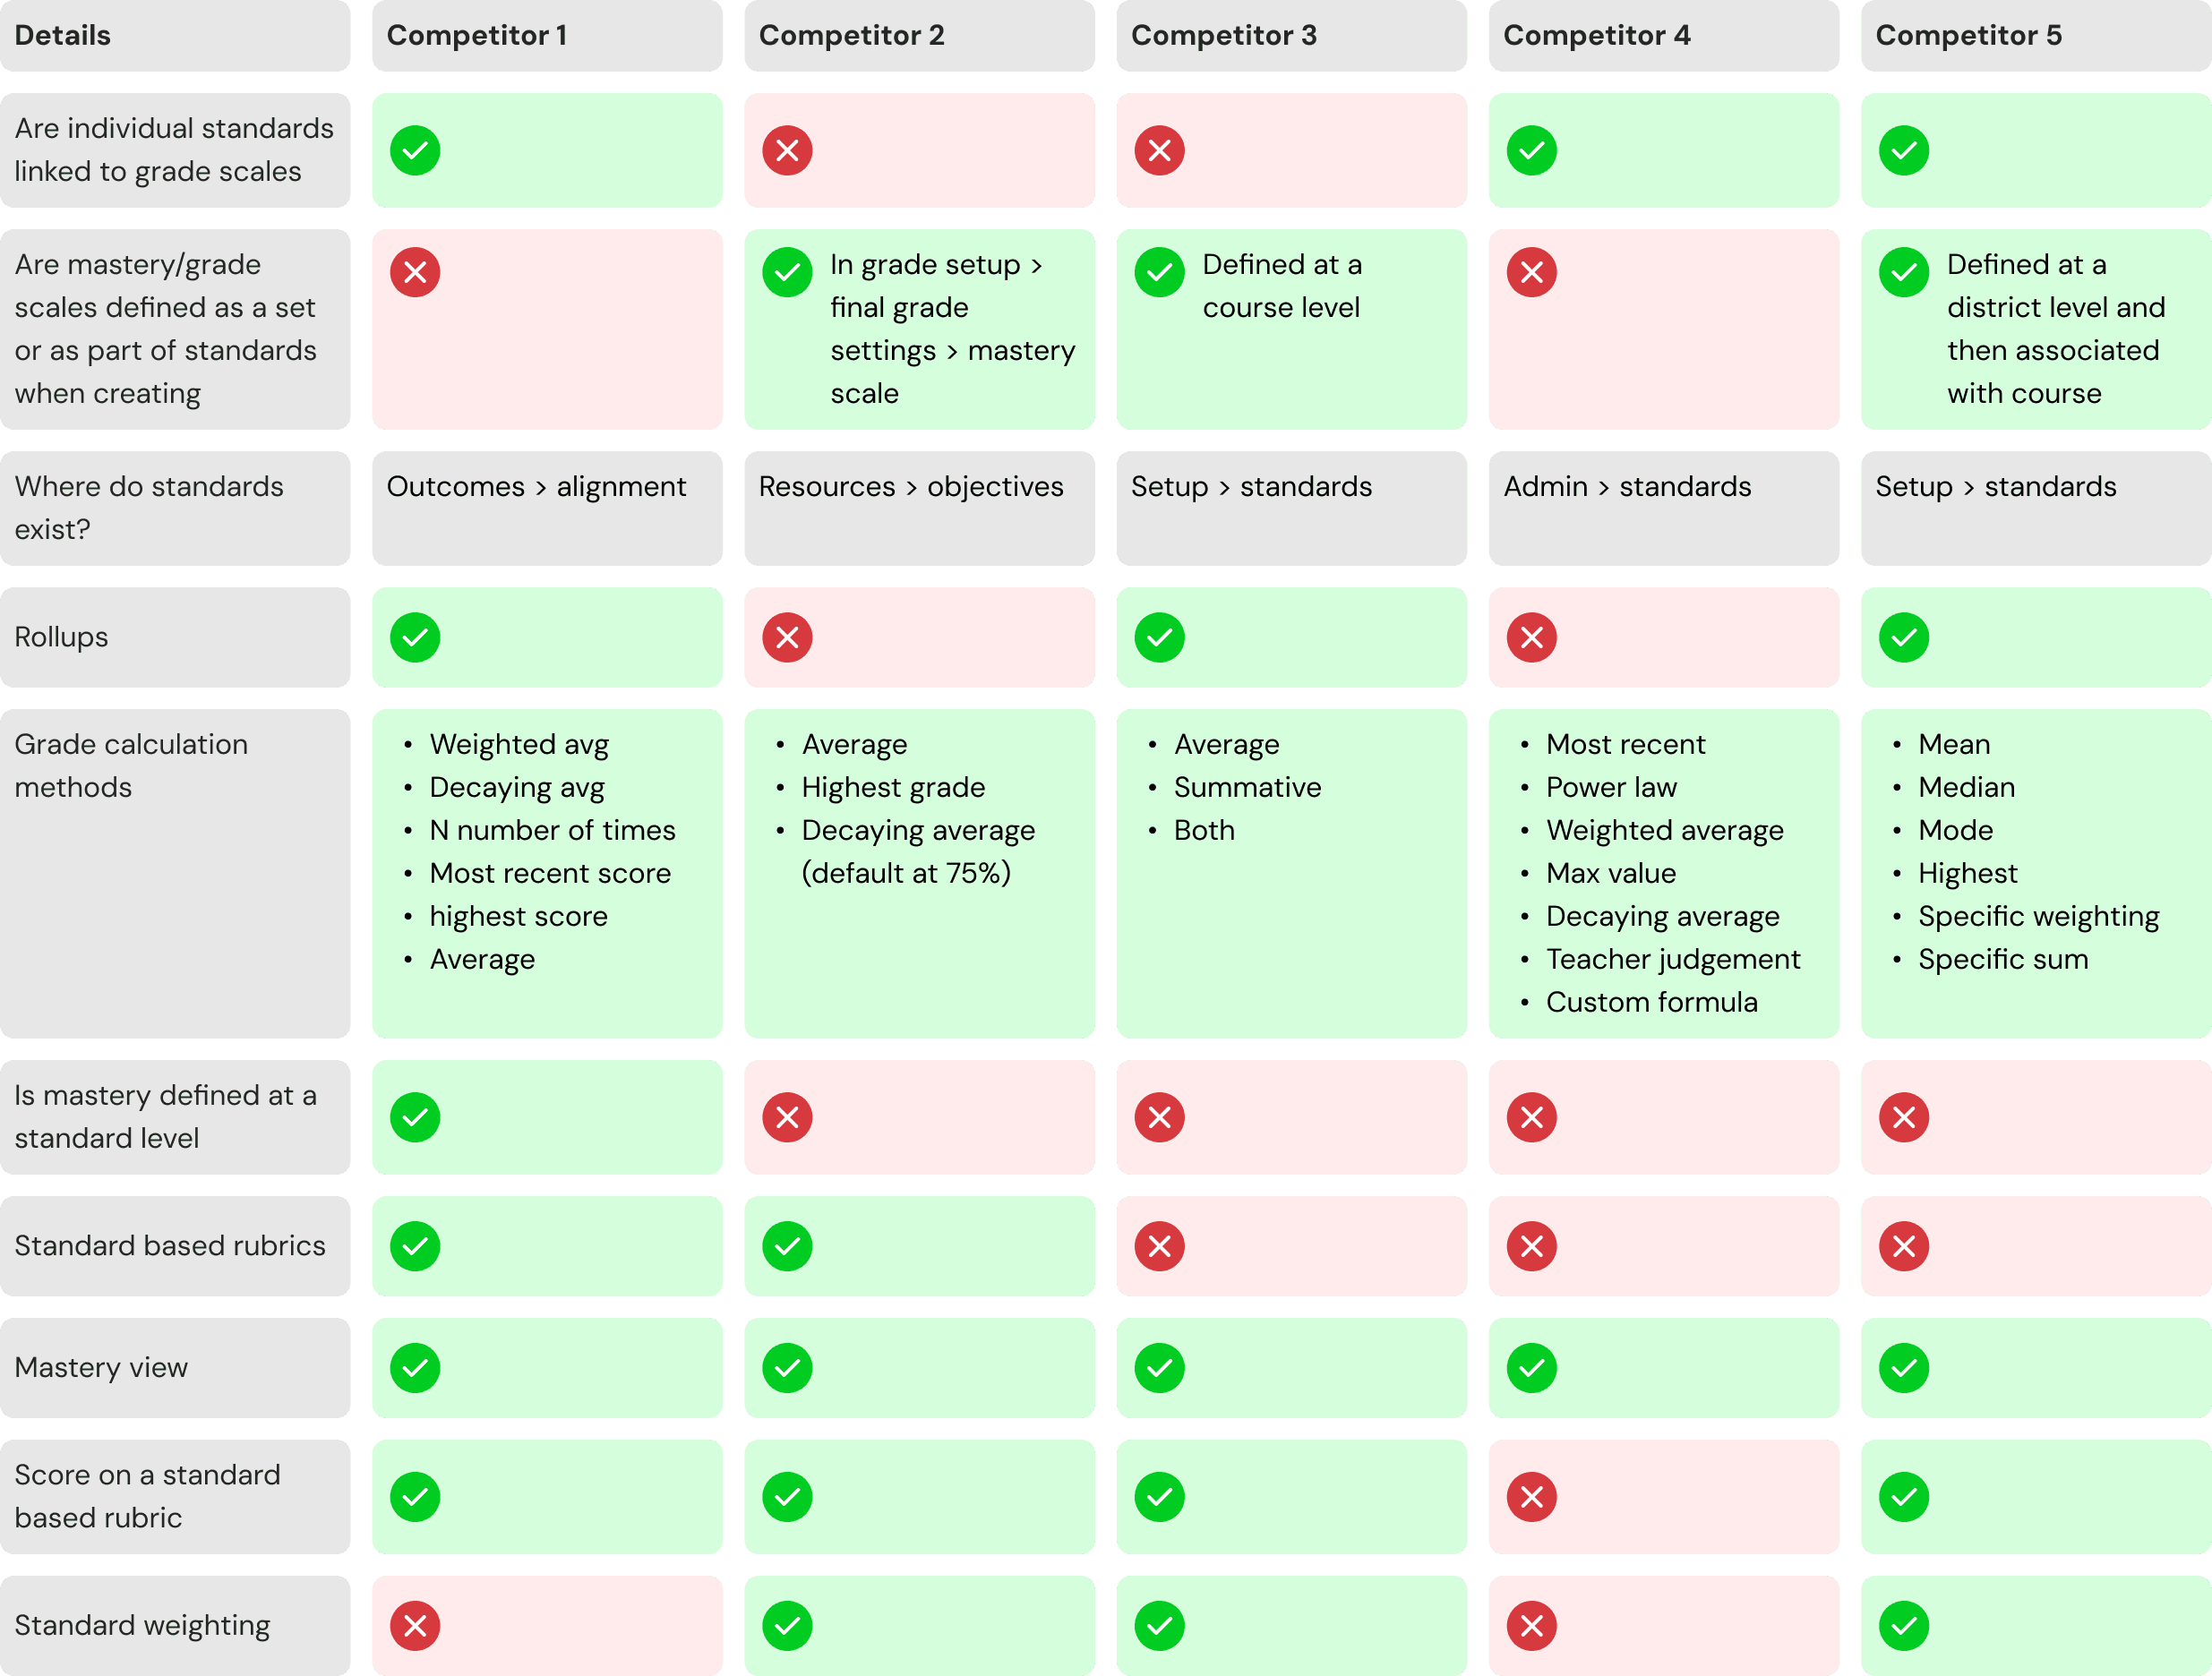
COMPETITOR ANALYSIS
Competitor analysis told us features vary across platforms, giving us a clear picture of where we could do better
To understand the landscape, I analysed leading platforms offering standards-based and score-based grading. Using help docs, freemium test accounts, and language models to validate findings, I mapped key insights across competitors - names withheld for confidentiality.
PERSONAS
We identified for 4 personas; Admins, course teachers, class teachers and student and family members; all with varying requirements
To understand the landscape, I analysed leading platforms offering standards-based and score-based grading. Using help docs, freemium test accounts, and language models to validate findings, I mapped key insights across competitors - names withheld for confidentiality.

As an admin, I want to
Configure standards for course teachers so they can import only what's relevant
View analytics on which standards are being taught and how frequently
See, course-wise, which standards are covered and how students are performing
I manage standards from multiple sources: Excel sheets, Common Core, and custom standards built with my team.

As a class teacher, I want to
Assess students against specific standards and support them in achieving mastery
Grade based on standards-aligned performance and override where my professional judgment differs from the score
Compare student performance against the class average to identify gaps and track progress over time
Report mastery to families by sharing how students are doing across each standard, not just a final grade

As a course teacher, I want to
Explore different standard sets and map them to my courses.
Give teachers autonomy to build their own rubrics while providing access to templates for consistency.

As student/family, I want to
see how I’ve performed across assignments and standards, and understand how to improve in specific areas.
PERSONAS
We then mapped the end-to-end flow across all four roles, from admin configuring standards to students viewing mastery, and validated each step through interviews and competitor research


IDENTIFYING CHANGES TO MAKE IN THE CURRENT SYSTEM
We mapped standards-based grading onto the existing system to identify what needed to change, what needed to be built new, and how it would affect every role from admin to student
We audited the existing score-based assessment and grading flow, then mapped where standards needed to be layered in. This helped us identify what could be adapted, what needed to be rebuilt, and what was entirely new. The white boxes show the existing flow, and the yellow boxes highlight the new capabilities added as part of this system.

PRODUCT ROADMAP AND PLANNING
We created a phased roadmap spanning 3 to 5 months to align teams and manage complexity across a system-wide build
This project ran in parallel with major Toddle 2.0 upgrades, including a new course structure, refreshed navigation, and roles and permissions.
Given the scale of dependencies, we broke the work into phases and used a feasibility,
desirability, and usability lens to prioritise decisions. Coordinating across teams was essential as each stream touched different parts of the system.


We turned research into prototypes, validated with schools, and iterated with engineering to ship
Please note that for brevity and confidentiality, I have not included decision making points and iterations and have omitted some details. Feel free to reach out to me personally to learn more about the project!
Throughout the course of this project, we made several decisions to improve the workflow and experience for each user type. These were shaped by ongoing conversations with demo schools and partner organisations.
Turned research into early prototypes
Mapping user needs and benchmarking competitor workflows Translated interview findings and competitive analysis into initial designs to establish a clear direction.
Gathered requirements from partner schools and validated direction through interactive demos
Worked directly with schools to ensure we were building the right thing before committing to a full build.
Partnered with engineering to evaluate feasibility, surface edge cases, and co-create a realistic roadmap
Close collaboration with the team ensured designs were grounded in what was actually shippable.
Iterated continuously through feedback loops, cadence calls, and adapting to evolving constraints
Regular touchpoints with developers helped resolve dependencies, address blockers, and refine designs as the system evolved.
RECAP FLOW
The flow
Admins can now create and manage assignment templates at the school level and push them out to teachers. Instead of starting from a blank slate every time, teachers have a structured starting point that reflects how their school actually runs assignments. Creation is faster, more consistent, and far less overwhelming.

THE SOLUTION
Uploading standards was a time sink so we used AI to speed them up and build a differentiator
Admins can now create and manage assignment templates at the school level and push them out to teachers. Instead of starting from a blank slate every time, teachers have a structured starting point that reflects how their school actually runs assignments. Creation is faster, more consistent, and far less overwhelming.
Schools had standards across spreadsheets and PDFs, so we built AI-powered import to save time for schools and our data entry team
Creating grade scales and mapping them to standard sets
Admins can create grade scales with cutoff percentages, grade values, and color coding, then map them directly to standard sets. We added a mastery column to the configuration so admins could designae which levels count as mastery, giving teachers a clear benchmark for student achievement against each standard.

Creating grade scales and adding rubric descriptors with AI
Admins can create rubric descriptor templates mapped to each grade scale level, so teachers have a structured starting point instead of writing descriptors from scratch. The datagrid experience supports inline editing, copy-paste, and AI-assisted generation, making configuration significantly faster than doing it manually.
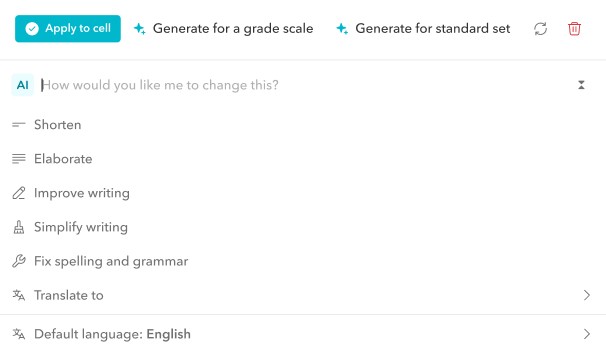
We allowed editing with AI apart from uploaded standards
Each grade scale can be configured with a name, color, mastery designation, cutoff values, and grade values to support different calculation methods.
We also built an AI interaction layer directly into the rubric descriptor flow, allowing admins to generate descriptors for a full grade scale or an entire standard set in one action, and then refine them using prompts, shorten, elaborate, simplify, or translate as needed.
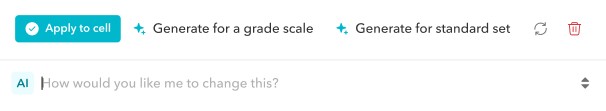
Using Calculation methods
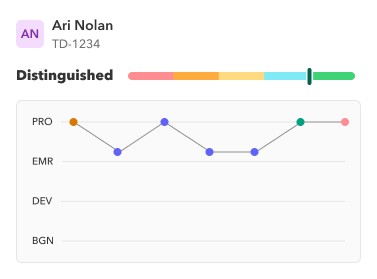
Admins can map each standard set to a calculation method that defines how student mastery is determined. For example, if they use the mean method for both individual and rollup grading, the final mastery score is calculated by averaging the grade values across all assessed standards, dividing by the number of assessments they were graded on, and converting the result back to the grade scale - yielding a final level like “Distinguished” or “Proficient”.
After reviewing competitor platforms and gathering user insights, we defined a set of calculation methods to support different grading preferences. These methods vary depending on whether the grade scale is numeric or alphabet based.
We created an interace to upload and create standards
Grade scales can be created with alphabetic or numeric values, with color options by level. A mastery value defines when a student has met enough standards to be considered proficient, and is used in calculating final grades using mapped cutoff and point values.
Admins can set up rubric descriptors as templates for teachers. These can be task specific and editable using a flexible datagrid with select, copy paste, and AI suggestions - making configuration faster than competitors, who lack this feature.
Admins can set up rubric descriptors as templates for teachers. These can be task specific and editable using a flexible datagrid with select, copy paste, and AI suggestions - making configuration faster than competitors, who lack this feature.
Creating a rubric with AI in an assignment
Admins and course teachers can also create assessment tools and add in standards for teachers to use.
Admins and course teachers can create reusable rubric templates, and class teachers can build rubrics directly in assignments, all with AI assistance and standards mapped to each criterion
Admins and course teachers can set up rubric templates at the school or course level for teachers to use as a starting point. Class teachers can also create rubrics directly within an assignment, with the option to pull in admin-created templates or build from scratch.
Teachers can provide context like the unit, grade level, and relevant standards, and Toddle AI will generate rubric descriptors tailored to the task. They can also attach files, switch languages, use voice input, or browse the suggestion library to guide the output.
]Once students submit their work, teachers grade using the rubric and the scores flow directly into the mastery gradebook, where the configured calculation method for the standard set is applied.


Using the mastery gradebook
The mastery gradebook gives teachers a standards-level view of every student in the class. Each row represents a standard and each column a student, with mastery levels shown at a glance across the full class.
Tracking progress with colour, history, and quick editing
We designed a progress bar for each student where each colour segment represents a level on the grade scale, showing how close a student is to reaching mastery across their standards. A grading history graph plots performance over time, with each point representing an assessment, colour-coded by type for clarity.
The final grade column is editable like a datagrid, allowing teachers to override values quickly when needed. We added keyboard shortcuts, bulk selection, and quick editing tools to make the gradebook fast to work with in real classroom conditions.

Creating analytics
We built mastery insights across three views: by student, by standard, and by course, giving teachers and admins a complete picture of how students are progressing against their standards. I collaborated with Likhit Grandhi, leading the insights team to get this done.
Visualisations including progress bars, mastery distribution bar charts, and course-wide mastery overviews
The student view shows each student's current mastery level, how many standards have been assessed, and their progress within their current level using a colour-coded progress bar. This lets teachers quickly identify who is close to moving up and who needs more support.
The course overview surfaces the overall mastery percentage across the class, broken down by mastery level, showing how many students are at Beginning, Developing, Emerging, or Proficient across all assessed standards.
The standards view shows performance on each standard across the class, with a mastery distribution breakdown and a list of students at each level, making it easy to spot which standards the class is struggling with and plan instruction accordingly.


A quick peek into the solution
For hiring managers, interviewers or anyone curious about the full process, send me an email. I would love to share more.
Shoot me an email
Shoot me an email
Failures and takeaways
Problems
A significant amount of time went into creating customized demo decks for each school, which slowed down progress.
Cross-team collaboration often took longer than expected. I spent considerable time realigning new team members or explaining project context from scratch.
I lacked a strong grasp of IB standards early on, which affected decision-making and slowed feature mapping.
What could i have done better?
I could have pre-identified a set of representative schools and created a reusable demo framework with minor tweakable components, instead of building from scratch each time. This would have saved time while still allowing for personalization where it mattered most.
Having a clear list of stakeholders and setting up a kickoff call early on across teams would have helped align expectations, reduce handover gaps, and avoid spending time repeatedly explaining the project scope.
Spending more time upfront to understand how IB schools interpret and apply standards would have helped me make faster, more informed decisions while mapping workflows or proposing solutions. Domain depth makes a difference, especially in education.
While I had a document that captured the project context, key assumptions, and open questions, I didn’t consistently update it. Keeping a document alive would have helped onboard collaborators faster and reduced repeated clarifications.
Lastly, I didn’t always protect time for deep, focused work. There were days I was constantly switching contexts or reacting to inputs. Better calendar discipline and clearer prioritization could have helped me create space for uninterrupted design and reflection.
Read what my peers and Head of Design say about me collaborating on the project!


